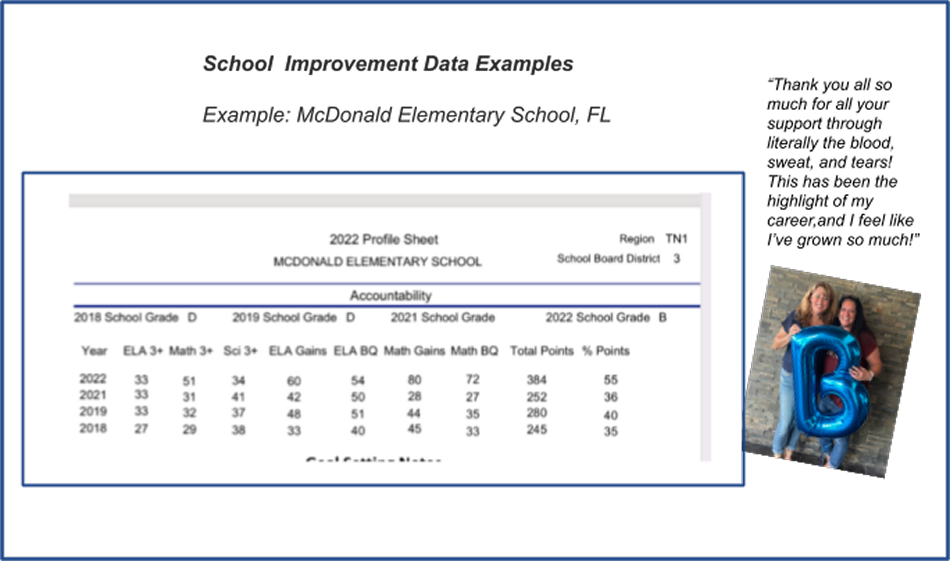
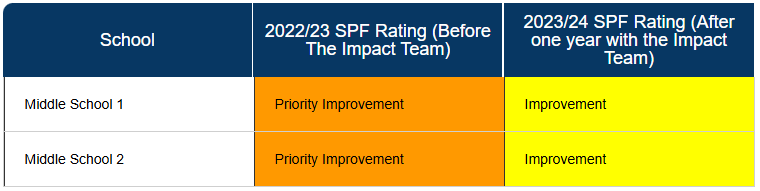
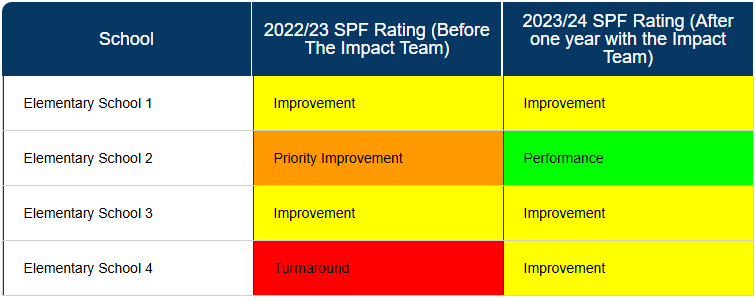
80% of our schools grow at least one performance band on their state report cards after one year.
Empowering school leaders nationwide — Join the movement today!
Unlock instructional excellence with expert coaching —Book a session now!
80% of our schools grow at least one performance band on their state report cards after one year.
Empowering school leaders nationwide — Join the movement today!
Unlock instructional excellence with expert coaching —Book a session now!
80% of our schools grow at least one performance band on their state report cards after one year.
Empowering school leaders nationwide — Join the movement today!
Unlock instructional excellence with expert coaching —Book a session now!
80% of our schools grow at least one performance band on their state report cards after one year.
Empowering school leaders nationwide — Join the movement today!
Unlock instructional excellence with expert coaching —Book a session now!